Dynamic Program Analysis for Fun and Profit with Dmitry Vyukov. Part of the LF Live: Mentorship Series.
Recently, I was accepted into the Linux Kernel Mentorship Program. If you’d told a younger Desmond that he’d be doing something like this, he would’ve been quite shocked because for the longest time the open source world had seemed so impenetrable. I am very grateful for this opportunity, and in a way, it’s a continuation of the long journey I embarked on since my earlier post on chasing large code bases.
As part of this journey, and in the spirit of open source work and learning in public, I’ve decided to document my experience working with the Linux kernel. One of the first tasks that was assigned to me was to watch a webinar on Dynamic Program Analysis, and I thought it’d be great to share my notes in a blog post.
Program analysis
Program analysis is the process of automatically analyzing the properties of a program, such as its performance and correctness, as well as to extract information such as the program’s call graph or the flow of data. This is useful for detecting, or deliberately provoking, bugs to allow you to harden your system.
The goals of program analysis are quite similar to the goals of observability: we want to reduce time to insight into a system. But on top of this, program analysis also endeavors to detect bugs before they occur in the wild.
There’s also a need to draw a distinction between dynamic and static program analysis, as the two are used to target different classes of bugs. Dynamic program analysis captures the properties of a running program, or more specifically, a single execution of a running program. In contrast, static analysis uses the source code to capture properties that hold for all executions of the program. However, such an ambitious goals comes with trade-offs. Consider the following example that Dmitry posed:
void func()
{
	char *p = malloc(10);
	p[20] = 1;
}
This C function makes an out-of-bounds access to p[20]. This seems simple enough to catch as long as we take note of the size allocated to a buffer and compare this against all subsequent accesses to that buffer. However, let’s now consider this scenario:
void func(int index)
{
	char *p = malloc(10);
	p[index] = 1;
}
Just by making the index into the buffer a variable, things have gotten a lot more complicated. We can’t make any assumptions about how the index might be computed, and it could be computed in many different ways in many different parts of the source code. Imagine if, in the computation of the index, other arrays and indices were involved (meaning we’d have to go even further back to figure things out), or if multiple threads were involved, or if multiple function calls are involved, or if a cryptographic function was used. The task for static analysis becomes very intractable.
But what about a dynamic program analyzer? Why, all it needs to do is memorize the size of the heap block when it was first allocated, then whenever the heap block is accessed, we compare the index with the block size and report an out-of-bounds bug as needed.
The key insight here is that complex bugs now become possible to analyze, and all bug reports are true positives because the bug actually happened. The downside is that these bugs can only be caught if the particular tests being run manages to trigger them. That aside, having no false positives makes dynamic analysis bug reports very very valuable. Like the boy who cried wolf, an analyzer that raises too many false alarms will find itself being ignored. It’s not like there’s no shortage of other bugs to deal with.
However, if you can trust the program analyzer’s bug report, then you can immediately flag issues with various commits and stop them from being merged into production. Or, if it’s already too late, you at least know that your time is being well spent when you dive deep into a bug.
Analysis tools
Now that we know how great dynamic program analysis is, how do we do it?
Instrumentation.
There’s many debugging configuration settings in the kernel that help catch bugs at compile and run time. Here’s an example for list debugging.
CONFIG_DEBUG_LIST
Linked lists are a very important data structure, so the kernel implements a common API for kernel developers to use. To link any objects together, one simply embeds a list_head into the structure that defines the object:
struct my_struct {
	struct list_head list;
	/* other fields here */
};
Once this is done, you can then use the provided list management functions to link your objects together. To ensure that your lists are set up properly, you can compile the kernel with CONFIG_DEBUG_LIST=y. Consider deleting entries from a linked list. If we take a look at include/linux/list.h, we’ll see the following:
#ifdef CONFIG_DEBUG_LIST
extern bool __list_add_valid(struct list_head *new,
			      struct list_head *prev,
			      struct list_head *next);
extern bool __list_del_entry_valid(struct list_head *entry);
#else
static inline bool __list_add_valid(struct list_head *new,
				struct list_head *prev,
				struct list_head *next)
{
	return true;
}
static inline bool __list_del_entry_valid(struct list_head *entry)
{
	return true;
}
#endif
When CONFIG_DEBUG_LIST is set, we see that a __list_del_entry_valid() function is declared but not defined. In lib/list_debug.c, we see the following definition:
bool __list_del_entry_valid(struct list_head *entry)
{
	struct list_head *prev, *next;

	prev = entry->prev;
	next = entry->next;

	if (CHECK_DATA_CORRUPTION(next == LIST_POISON1,
			"list_del corruption, %px->next is LIST_POISON1 (%px)\n",
			entry, LIST_POISON1) ||
	    CHECK_DATA_CORRUPTION(prev == LIST_POISON2,
			"list_del corruption, %px->prev is LIST_POISON2 (%px)\n",
			entry, LIST_POISON2) ||
	    CHECK_DATA_CORRUPTION(prev->next != entry,
			"list_del corruption. prev->next should be %px, but was %px\n",
			entry, prev->next) ||
	    CHECK_DATA_CORRUPTION(next->prev != entry,
			"list_del corruption. next->prev should be %px, but was %px\n",
			entry, next->prev))
		return false;

	return true;

}
EXPORT_SYMBOL(__list_del_entry_valid);
Here, we see that in addition to list deletion, we also check that the invariant properties of a linked list still hold.
A comprehensive list of other debug configurations be found on slide 23 of Dmitry’s presentation onwards, but for convenience, I’ve also compiled them into a markdown list.
In addition, Dmitry mentions that using functions such as BUG_ON() and WARN_ON() are also very helpful. These are the kernel equivalents of assert statements, and if you use them in your functions, you can ensure that any assumptions you make will be true (and if not, the kernel crashes or emits a warning). It also makes for strong documentation, because you don’t just tell yourself and other developers what should be the state of the program, you assert it.
KASAN (Kernel Address SANitizer)
KASAN is a tool (turned on by setting CONFIG_KASAN=y) to detect bad memory accesses, such as out-of-bounds errors, or use-after-free errors, for heap, stack, and global variables:
p = kmalloc(10);
p[20] = 1; // out-of-bounds

kfree(p);
p[0] = 1; // use-after-free
The problem with bad memory accesses is that you don’t realize there’s a problem until much later. As Dmitry elegantly puts it, you’d expect such bugs to make a program go boom. However, programs will happily write to out-of-bounds memory then carry on with other work. It’s only until the corrupted memory is used that we might experience a crash. And by that time, the source of our bug would have flowed down the river and we won’t know where to begin debugging.
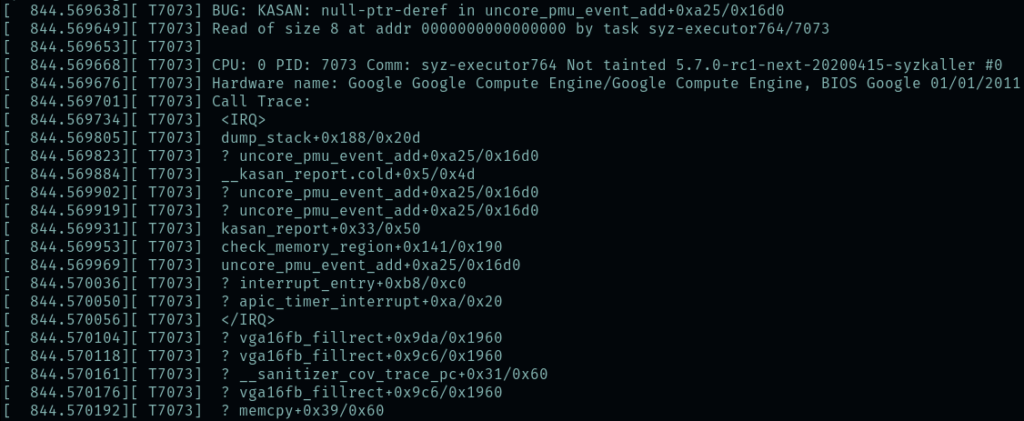
KASAN makes the things that should go boom, well, go boom. Here’s the sample KASAN output from Dmitry’s slides:
BUG: KASAN: use-after-free in remove_wait_queue
Write of size 8 by task syzkaller/10568

Call Trace:
list_del include/linux/list.h:107
__remove_wait_queue include/linux/wait.h:145
remove_wait_queue+0xfb/0x120 kernel/sched/wait.c:50
...
SYSC_exit_group kernel/exit.c:885

Allocated:
kmem_cache_alloc+0x10d/0x140 mm/slub.c:2517
sk_prot_alloc+0x69/0x340 net/core/sock.c:1329
sk_alloc+0x33/0x280 net/core/sock.c:1404
...
SYSC_socketpair net/socket.c:1281

Freed:
kmem_cache_free+0x161/0x180 mm/slub.c:2745
sk_prot_free net/core/sock.c:1374
...
SYSC_write fs/read_write.c:585
Here we see the error that occurred (use-after-free), where it happened, the context in which it was called, where the memory in question was allocated, and when it was freed. Awfully convenient isn’t it.
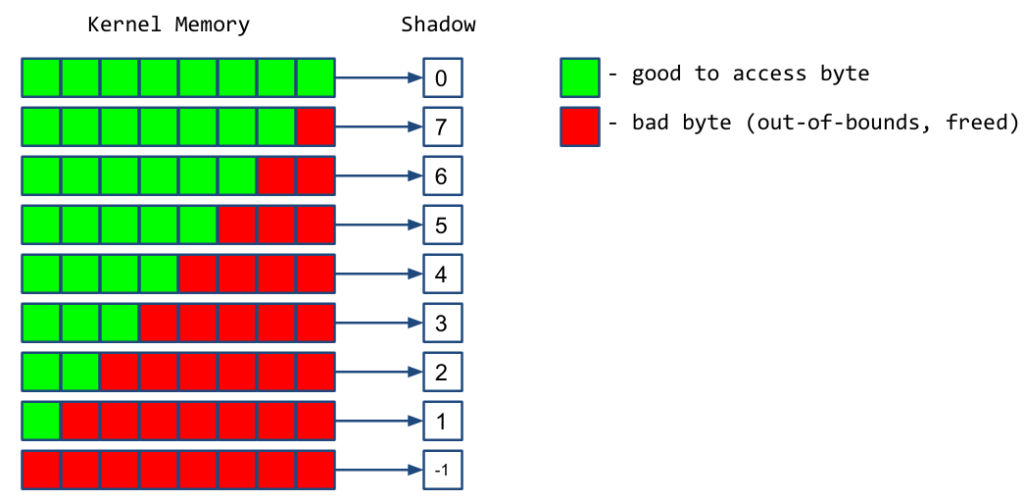
How does this work under the hood? KASAN assigned a shadow byte for every 8 bytes of kernel memory. This shadow byte contains information on whether the kernel memory is good to access, or bad, meaning that it’s been freed or it’s out-of-bounds.
Then, during compilation, every memory access is instrumented to check that the accessed kernel memory locations are valid. For example, if we want to write to the address p:
*p = 1; // 8 bytes
Then the compiler adds a check beforehand:
shadow = p >> 3 + 0xdffffc0000000000;
if (*shadow)
	kasan_report8(p);
*p = 1;  // 8 bytes
Now that we have a mechanism to ensure that only good memory locations are accessed, we modify our virtual addresses to catch errant memory accesses.
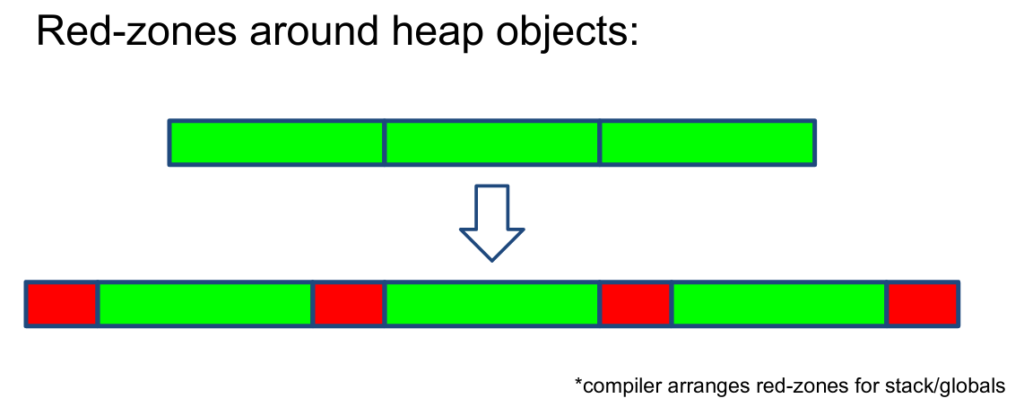
If we try to access memory that’s out-of-bounds, we’ll likely step into a red-zone and be alerted.
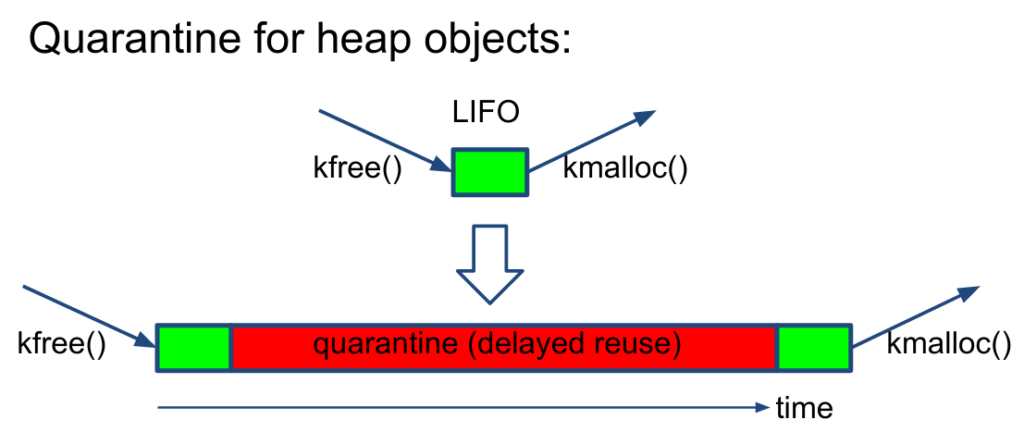
We can also add a delay between freeing and re-allocating memory (since memory is allocated last-in-first-out), to catch instances of using memory after it’s been freed. Presumably these use-after-free bugs happen close to when freeing happens (in terms of code, they’re probably just a few lines apart), so this delay would be effective.
Of course, it’s important to note that these methods won’t catch all memory access bugs. But it catches many of them at the places where they’re likely to occur (at the ends of allocated memory, or right after memory has been freed), and indeed in practice KASAN has done very well and caught some 1000 bugs in the past few years. What’s important is that there are no false positives, so if you see a KASAN bug, you act on it; and there’s low barriers to adoption because it works out of the box, and has low overheads (~2x slowdown, and ~2x memory overheads).
Conclusion
So after all this discussion on dynamic program analysis, where does the “fun and profit” come in? This wasn’t explicitly discussed in the webinar, but I think it’s worth reflecting on for a bit.
The profit aspect is clear. Program analysis is a cost-effective way to find bugs. Bugs are expensive. They can take hours, days, or even months of developer effort to solve. But you know what’s an especially costly bug? One that’s been allowed to wreck havoc in the wild. If you can catch bugs when they happen (see: make things that should explode go boom), then you can fix it much more easily. Much better than trying to swim through 30 million lines of code.
And the fun part? Well, it’s fun to have a clear and concrete challenge in front of you, isn’t it. If a program analysis tool takes out all the mystery and tells you that there’s a bug at such-and-such line, where the memory was allocated here, and freed over there, then all that’s left is for you to roll up your sleeves and get to it.
Pingback: Bug hunting in the Linux kernel – Desmond Cheong
Pingback: Building the Linux kernel with CONFIG_KASAN – Desmond Cheong
Pingback: Vignettes of a Linux Kernel Mentee – Desmond Cheong